
GNNs for Traffic Forecasting
Published:
The Traffic Forecasting Task
Intuition First: Traffic networks are like dominoes: a slowdown at one sensor topples the next. An ARIMA model at each sensor sees its own history but is blind to the upstream jam that caused its own slowdown, it only “learns” the pattern once the slowdown arrives. A GNN-augmented model receives advance warning: neighbouring sensors upstream are already slowing, so the spatial signal arrives before the temporal consequence does. That advance warning is the whole reason graph structure helps here, and the benefit grows with the forecasting horizon, at 5 minutes ahead your own history is nearly sufficient, at an hour ahead it is not.
Input: \(X \in \mathbb{R}^{N \times T \times d}\), readings from \(N\) sensors over \(T\) past timesteps, each with \(d\) features (speed, volume, occupancy)
Output: \(\hat{X} \in \mathbb{R}^{N \times H \times d}\), predictions for \(H\) future timesteps
Graph: \(G = (V, E, W)\) where \(V\) is the sensor set, \(E\) the road segments connecting them, and \(W\) the edge weights (road distance, travel time, or measured correlation)
Standard benchmarks:
- METR-LA: 207 sensors on LA freeways, 4 months, 5-min intervals
- PEMS-BAY: 325 sensors in Bay Area, 6 months
Typical forecasting horizons: 15 min (3 steps), 30 min (6 steps), 60 min (12 steps).
Why Graphs Improve over ARIMA and LSTM
ARIMA / LSTM (per-sensor): each sensor is modelled independently. Cannot capture spatial correlations, “upstream congestion causes downstream slowdown” is invisible.
CNN on grid: grids work for regular spatial layouts (weather stations on a regular grid). Traffic networks are irregular, sensors follow road geometry, not a grid.
GNN + temporal model: captures both spatial (road network structure) and temporal (recurrent patterns) dependencies.
DCRNN (Diffusion Convolutional Recurrent Neural Network)
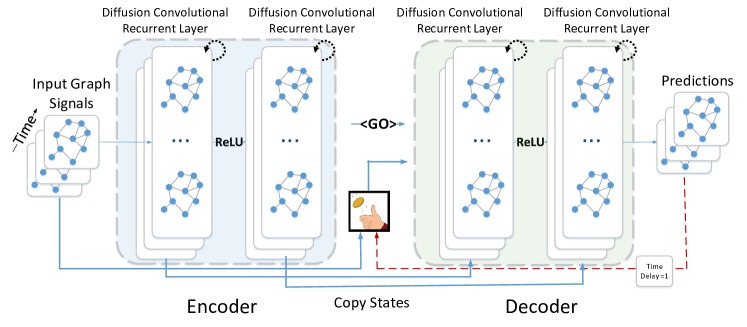
DCRNN (Li et al., 2018) uses bidirectional random walk diffusion as the spatial module inside a sequence-to-sequence GRU:
Diffusion convolution (captures directional traffic flow):
where \(D_O\) and \(D_I\) are the out-degree and in-degree matrices, so \(D_O^{-1} A\) is the row-stochastic transition matrix of a random walk along the direction of travel. Raising it to the power \(k\) gives the distribution after \(k\) steps: forward diffusion follows traffic downstream, backward diffusion carries the reverse influence (a closure downstream backs traffic up).
Encoder-decoder: DCRNN encodes the \(T\) past steps with a diffusion-GRU encoder and decodes \(H\) future steps, using scheduled sampling to reduce exposure bias.
Result on METR-LA: DCRNN lowers MAE against both statistical baselines (ARIMA, VAR) and temporal-only neural ones (FC-LSTM) at every horizon reported in the paper, and the margin over the graph-free baselines widens as the horizon lengthens, which is exactly what the “advance warning” story predicts.
STGCN (Spatio-Temporal Graph Convolutional Network)
STGCN (Yu et al., 2018) replaces recurrence with 1D temporal convolutions for speed:
Block: [Temporal gated conv] → [Spatial ChebNet] → [Temporal gated conv]
Temporal gated convolution (GLU), where \(*\) is 1D convolution along time and \(\odot\) is element-wise product:
The second branch acts as a learned gate deciding how much of the first branch passes through at each timestep. Because there is no recurrence, the whole temporal dimension is computed in parallel rather than step by step, which is where the training-time advantage over DCRNN comes from.
Result: the paper reports accuracy comparable to DCRNN on the standard benchmarks at substantially lower training cost.
Graph Wave Net (Wu et al., 2019)
Adds an adaptive adjacency matrix learned from data rather than read off the road geometry:
\(E_1\) and \(E_2\) are learnable node embeddings, so the model discovers which sensors influence each other instead of assuming that road adjacency is the only channel. The ReLU zeroes out negative affinities to keep \(\tilde{A}\) sparse, and the row-wise softmax normalises it into a transition matrix. This picks up non-geographic correlations, sensors that are far apart yet behave alike, such as parallel highways carrying the same commute.
Also uses dilated causal convolutions (like WaveNet) for temporal modelling, wider receptive field than standard 1D conv without more parameters.
Worked Example: Spatial vs Temporal Signal
This is an illustrative toy scenario, not measured data, the point is the mechanism, not the digits.
Setup: three sensors in a chain, \(A \to B \to C\). At \(t=0\) all three read 60 mph. An incident hits \(A\), so at \(t=1\) we observe \(A = 20\), \(B = 55\), \(C = 60\) mph.
LSTM (per-sensor, no graph): sensor \(B\)’s history is \([60, 55]\), a mild slowdown, extrapolating to roughly 52 mph at \(t=2\). But the jam is about to arrive, and \(B\)’s own history contains no trace of it yet.
DCRNN (graph-aware): the edge \(A \to B\) delivers \(A\)’s reading to \(B\) at \(t=1\). With diffusion weights of, say, 0.6 on the upstream neighbour and 0.4 on \(B\) itself, the spatial term is
which drags the prediction down towards the incoming jam instead of extrapolating \(B\)’s own gentle decline.
The gain: the graph gives \(B\) advance warning that its own temporal history cannot contain yet, because the information physically has not reached \(B\)’s sensor. This is why the advantage of graph-based models over temporal-only ones grows with the forecast horizon, the further ahead you predict, the more of the answer is currently sitting at some other node.
Industrial Deployment
The best-documented deployment is Google Maps. Derrow-Pinion et al. (2021) describe the GNN ETA model that went into production there, and the mechanism is a direct application of everything above: the road network is partitioned into supersegments, sequences of connected road segments corresponding to plausible routes, and each supersegment becomes a graph whose nodes are segments and whose edges are their connections. A GNN over that graph predicts travel time, with the graph structure supplying exactly the upstream/downstream context a per-segment model would miss. The authors report substantial reductions in negative ETA outcomes across several metropolitan areas relative to the previous production baseline.
Summary
| Model | Spatial | Temporal | Speed |
|---|---|---|---|
| ARIMA | None | Statistical | Fast |
| LSTM | None | Recurrent | Medium |
| DCRNN | Diffusion GCN | Encoder-decoder GRU | Slow (recurrent) |
| STGCN | ChebNet | Gated 1D conv | Fast (parallel) |
| Graph Wave Net | Adaptive adjacency | Dilated causal conv | Fast |
Traffic forecasting is the canonical spatio-temporal GNN application, a clean problem definition, public benchmarks, and at least one thoroughly documented production deployment. The mechanism worth carrying away is narrow and concrete: because congestion physically travels along roads, the information needed to predict a sensor’s near future is currently located at its upstream neighbours, and a GNN is simply the machinery for reading it from there.
References
- Li, Y., Yu, R., Shahabi, C., & Liu, Y. (2018). Diffusion Convolutional Recurrent Neural Network: Data-Driven Traffic Forecasting. ICLR 2018 (DCRNN: bidirectional diffusion convolution on road graphs combined with GRU encoder-decoder for traffic speed prediction).
- Yu, B., Yin, H., & Zhu, Z. (2018). Spatio-Temporal Graph Convolutional Networks: A Deep Learning Framework for Traffic Forecasting. IJCAI 2018 (STGCN: fully convolutional approach replacing recurrent temporal processing with gated 1D convolution for faster training).
- Wu, Z., Pan, S., Long, G., Jiang, J., Chang, X., & Zhang, C. (2020). Connecting the Dots: Multivariate Time Series Forecasting with Graph Neural Networks. KDD 2020 (learns the graph structure adaptively alongside dilated causal convolutions for long-range temporal patterns).
- Derrow-Pinion, A., She, J., Wong, D., Lange, O., Hester, T., Perez, L., Nunkesser, M., Lee, S., Guo, X., Wiltshire, B., Battaglia, P. W., Gupta, V., Li, A., Xu, Z., Sanchez-Gonzalez, A., Li, Y., & Veličković, P. (2021). ETA Prediction with Graph Neural Networks in Google Maps. CIKM 2021 (the production GNN ETA model in Google Maps, built on road-network supersegments).